 ar
ar bg
bg hr
hr cs
cs da
da nl
nl fi
fi fr
fr de
de el
el hi
hi it
it ko
ko no
no pl
pl pt
pt ro
ro ru
ru es
es sv
sv tl
tl iw
iw id
id lv
lv lt
lt sr
sr sk
sk sl
sl uk
uk vi
vi et
et hu
hu th
th tr
tr fa
fa ms
ms hy
hy ka
ka ur
ur bn
bn mn
mn ta
ta kk
kk uz
uz ku
ku
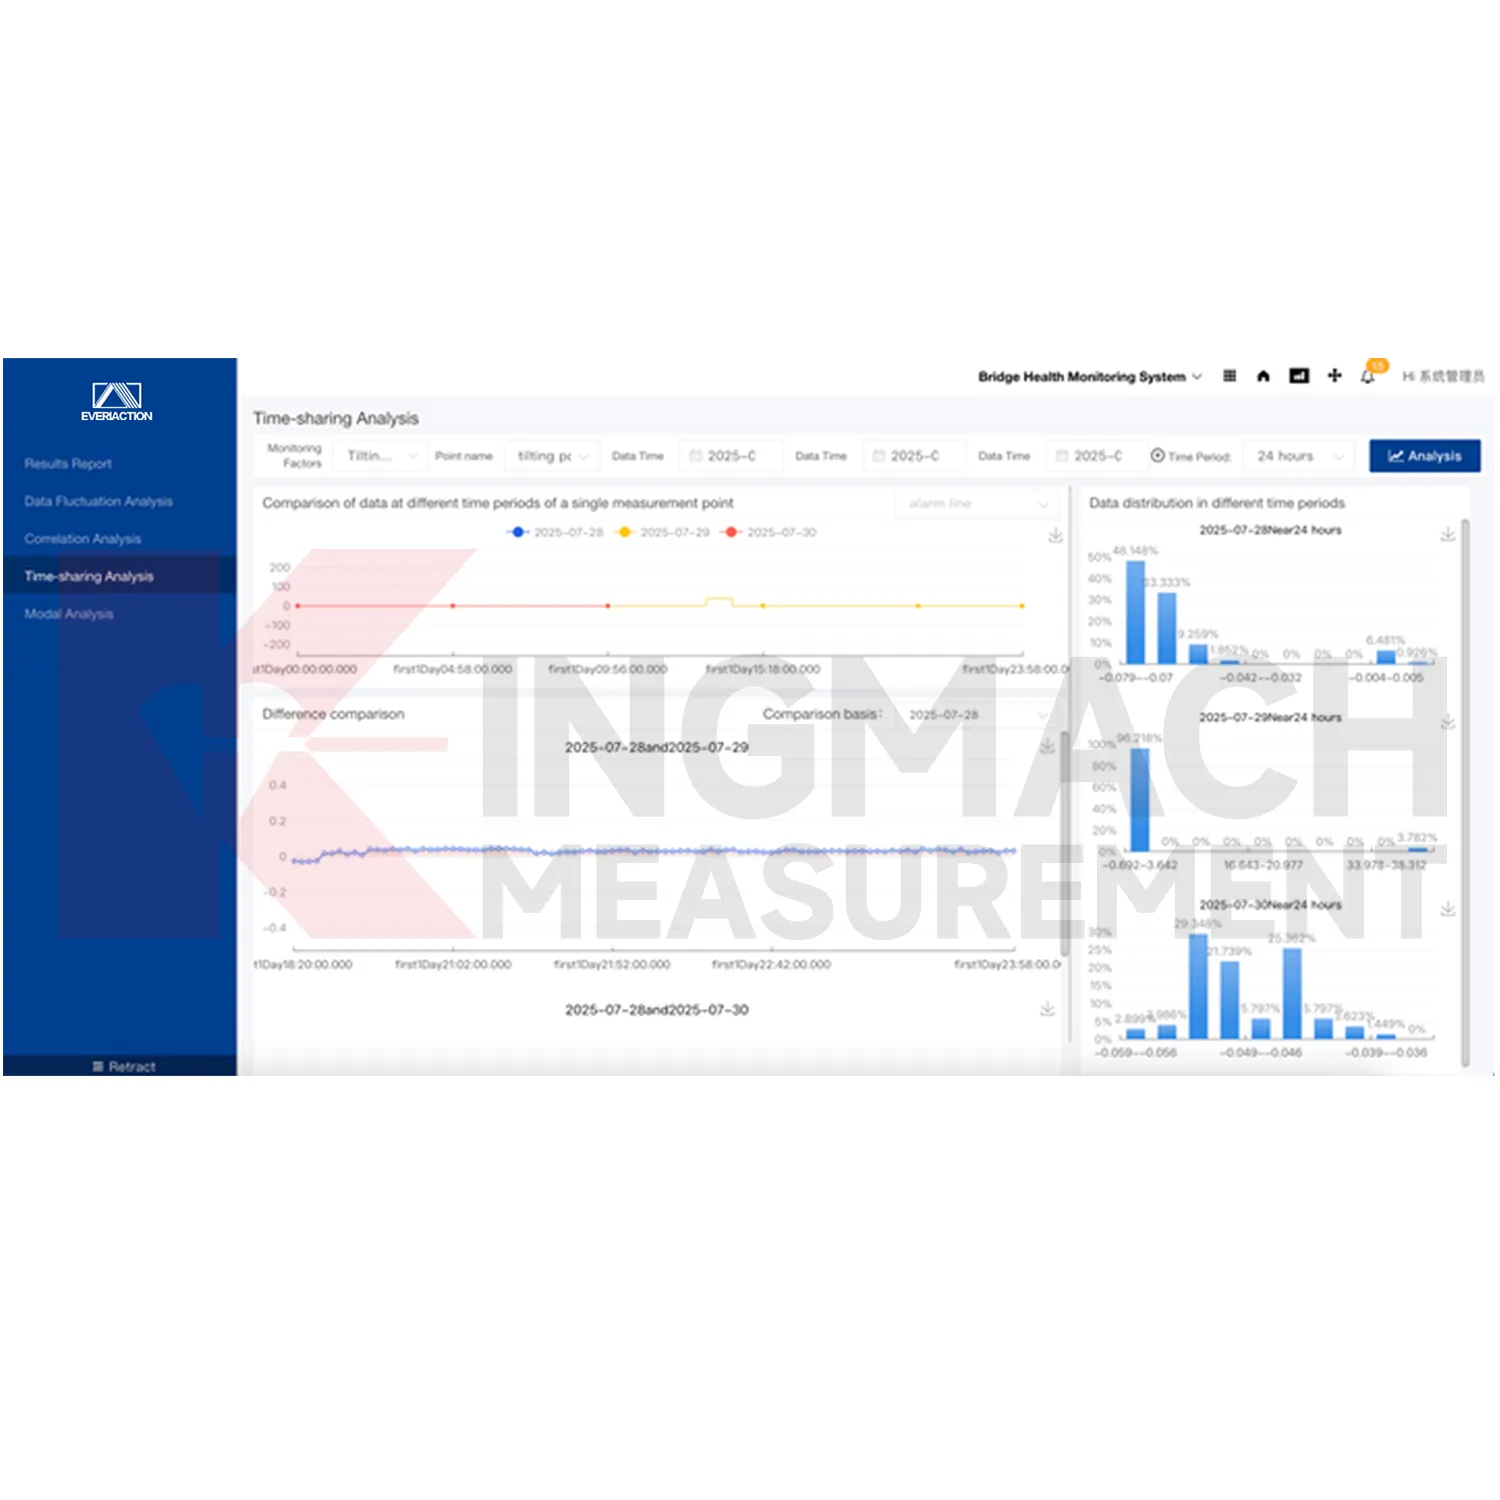
LoRa DTU
Kingmach LoRa DTU supports project-based management. Users can create new projects and operate a single project as a management unit. The platform can update and maintain basic project information, dynamic project information, inspection and maintenance records, alarm levels, and project documents. This structure is useful for owners who need long-term records across different assets, phases, and teams. It also makes handover easier because data, alarms, documents, and maintenance history are not stored in unrelated places.
Application of LoRa DTU
Multi-site asset management uses Kingmach LoRa DTU when an owner needs consistent monitoring records across several projects. Each project can keep its own basic information, dynamic information, alarm levels, documents, and maintenance records while still following a common digital workflow. This is useful for infrastructure owners, engineering firms, and maintenance teams that manage bridges, tunnels, slopes, buildings, and hydraulic structures at the same time. Standardized visualization and reporting make cross-project review more efficient.
The future of LoRa DTU
Digital twin projects will use Kingmach LoRa DTU as the live data layer behind structural models. A twin needs current readings, historical trends, device identity, alarm status, and inspection records to stay meaningful. The platform can help feed that model with organized monitoring data from many instrument types. When a bridge, tunnel, dam, building, or slope changes, the twin can be updated with both sensor evidence and field notes, making the virtual record closer to the real asset condition.
Care & Maintenance of LoRa DTU
Device access for Kingmach LoRa DTU should be checked carefully during commissioning. Confirm whether each instrument or acquisition module is sending data by the planned wired or wireless method. Verify channel identity, unit, timestamp, point location, and first stable value before the platform is accepted. A clean commissioning record prevents later confusion when an alarm appears. If a channel is missing, duplicated, or mislabeled, fix the data path before routine monitoring begins.
Kingmach LoRa DTU
Kingmach LoRa DTU helps users move from raw readings to risk awareness. The platform can build structural safety models, use formulas, algorithms, and manual engineering review to determine the location and extent of structural damage, and warn of changes in structural performance. This does not replace field inspection; it makes inspection better targeted. When a bridge cable, tunnel lining, slope, dam gallery, or building foundation shows a changing pattern, the data view can point reviewers toward the affected area, related sensors, and alarm record. That gives site teams a clearer starting point for follow-up.
FAQ
Q: How should a project be prepared?
A: Define asset folders, monitoring zones, measuring points, units, alert grades, and report needs before launch.
Q: What should be tested at go-live?
A: Test incoming values, time order, engineering units, graph refresh, alarm trigger, and export output.
Q: Why does alarm logic need review?
A: Different sensor categories and risk levels may need different limits, rates, and escalation steps.
Q: How should files stay current?
A: Update drawings, point lists, photos, inspection notes, maintenance logs, and reports when the site changes.
Q: What should follow a platform update?
A: Run a short acceptance check on live values, graph pages, alerts, exports, accounts, and stored files.
Reviews
Robert Taylor
The weir flow meter is well-built and delivers accurate measurements. Great value for water management applications.
Joshua Clark
We ordered a full monitoring solution including sensors and data loggers. Everything works seamlessly together. Great supplier!
Latest Inquiries
To protect the privacy of our buyers, only public service email domains like Gmail, Yahoo, and MSN will be displayed. Additionally, only a limited portion of the inquiry content will be shown.
Isabella***@gmail.comGermany
Hello, we are evaluating weir flow meters for a water management project. Please share accuracy deta...
Harper***@gmail.comIndia
Dear Sir, we are planning to procure a complete monitoring system including strain gauges, tiltmeter...
Related product categories
- Data Acquisition
- Web-based Monitoring Software
- Monitoring system software platform
- Visualization Software
- Accessories
- Guidewheel Measuring Rod
- Monitoring system software platform
- Structural Health Monitoring Sensors
- Web-based Monitoring Software
- Software Platform
- Data management software
- Monitoring Software Suite